Working Directory
Manually Enter Data
dat <- data.frame(X = c(4.1, 5.2, 7.5, 8.2, 9.3, 3.1, 1.6,
                        6.0, 7.4, 6.5, 5.1, 9.6, 2.8, 5.9),
                  Y = c(15.1, 11.2, 22.5, 25.4, 26.0, 10.5, 9.9,
                        17.7, 19.9, 16.5, 14.3, 30.2, 9.7, 15.7))
colnames(dat) <- c("June1234", "June5678")   # change the variable name

dat                           # view the data
   June1234 June5678
1       4.1     15.1
2       5.2     11.2
3       7.5     22.5
4       8.2     25.4
5       9.3     26.0
6       3.1     10.5
7       1.6      9.9
8       6.0     17.7
9       7.4     19.9
10      6.5     16.5
11      5.1     14.3
12      9.6     30.2
13      2.8      9.7
14      5.9     15.7
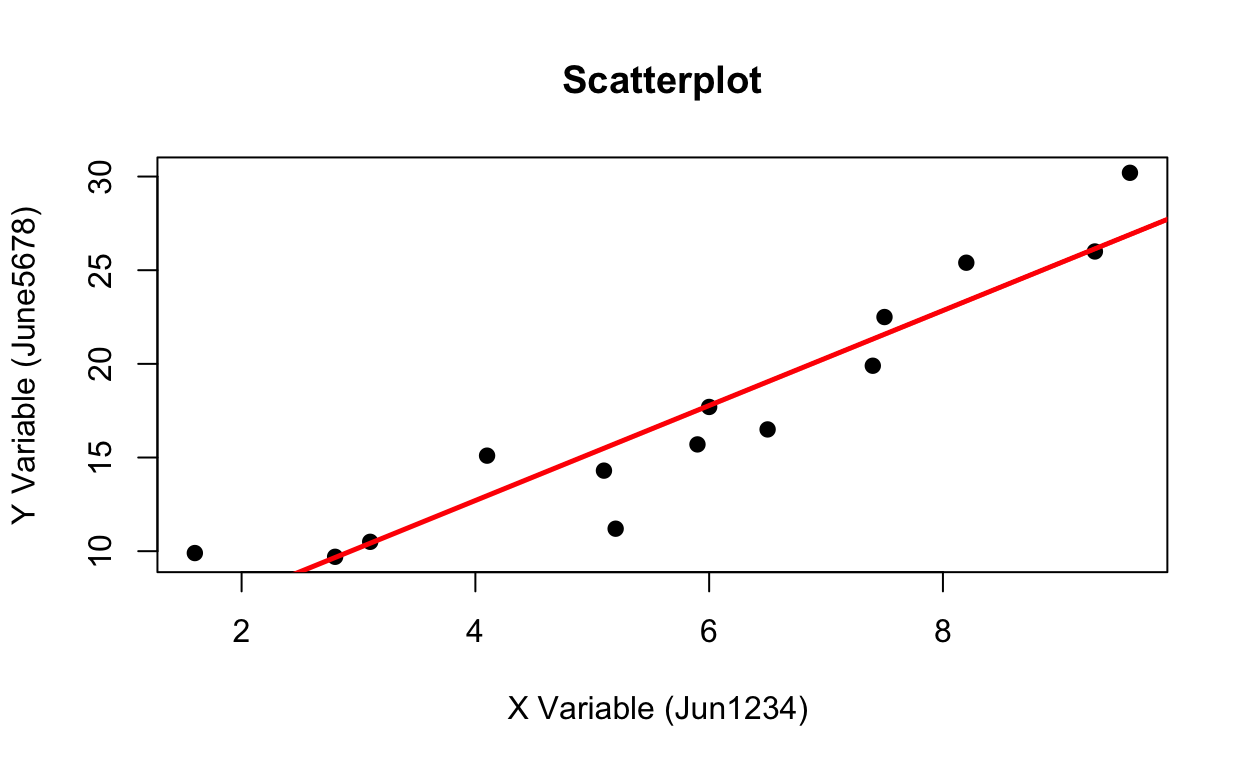
Scatterplot
plot(x = dat$June1234, y = dat$June5678, main="Scatterplot",
   xlab = "X Variable (Jun1234) ", ylab = "Y Variable (June5678)", pch = 19)

# add a regression fit line
plot(x = dat$June1234,
     y = dat$June5678,
     main="Scatterplot",
     xlab = "X Variable (Jun1234) ",
     ylab = "Y Variable (June5678)", pch = 19)
abline(lm(dat$June5678 ~ dat$June1234), col="red", lwd = 2.5)
Correlation
    Pearson's product-moment correlation

data:  June1234 and June5678
t = 9.4868, df = 12, p-value = 6.309e-07
alternative hypothesis: true correlation is not equal to 0
95 percent confidence interval:
 0.8148934 0.9809951
sample estimates:
      cor
0.9393361
Regression
rfit <- lm(dat$June5678 ~ dat$June1234)
summary(rfit)
Call:
lm(formula = dat$June5678 ~ dat$June1234)

Residuals:
    Min      1Q  Median      3Q     Max
-4.5503 -1.3719 -0.0213  1.7595  3.2898

Coefficients:
             Estimate Std. Error t value Pr(>|t|)
(Intercept)    2.5614     1.6906   1.515    0.156
dat$June1234   2.5363     0.2674   9.487 6.31e-07 ***
---
Signif. codes:  0 '***' 0.001 '**' 0.01 '*' 0.05 '.' 0.1 ' ' 1

Residual standard error: 2.331 on 12 degrees of freedom
Multiple R-squared:  0.8824,    Adjusted R-squared:  0.8725
F-statistic:    90 on 1 and 12 DF,  p-value: 6.309e-07